Use case · Data videos
Make data easy to follow.
Make data and explanation videos in Framebit. Turn charts, comparisons, lists, and key points into clear stories with coordinated animation and visual hierarchy. Start from a chart template or prompt, add your numbers, and control the pacing so each takeaway lands — then export for a post, a presentation, or an explainer.
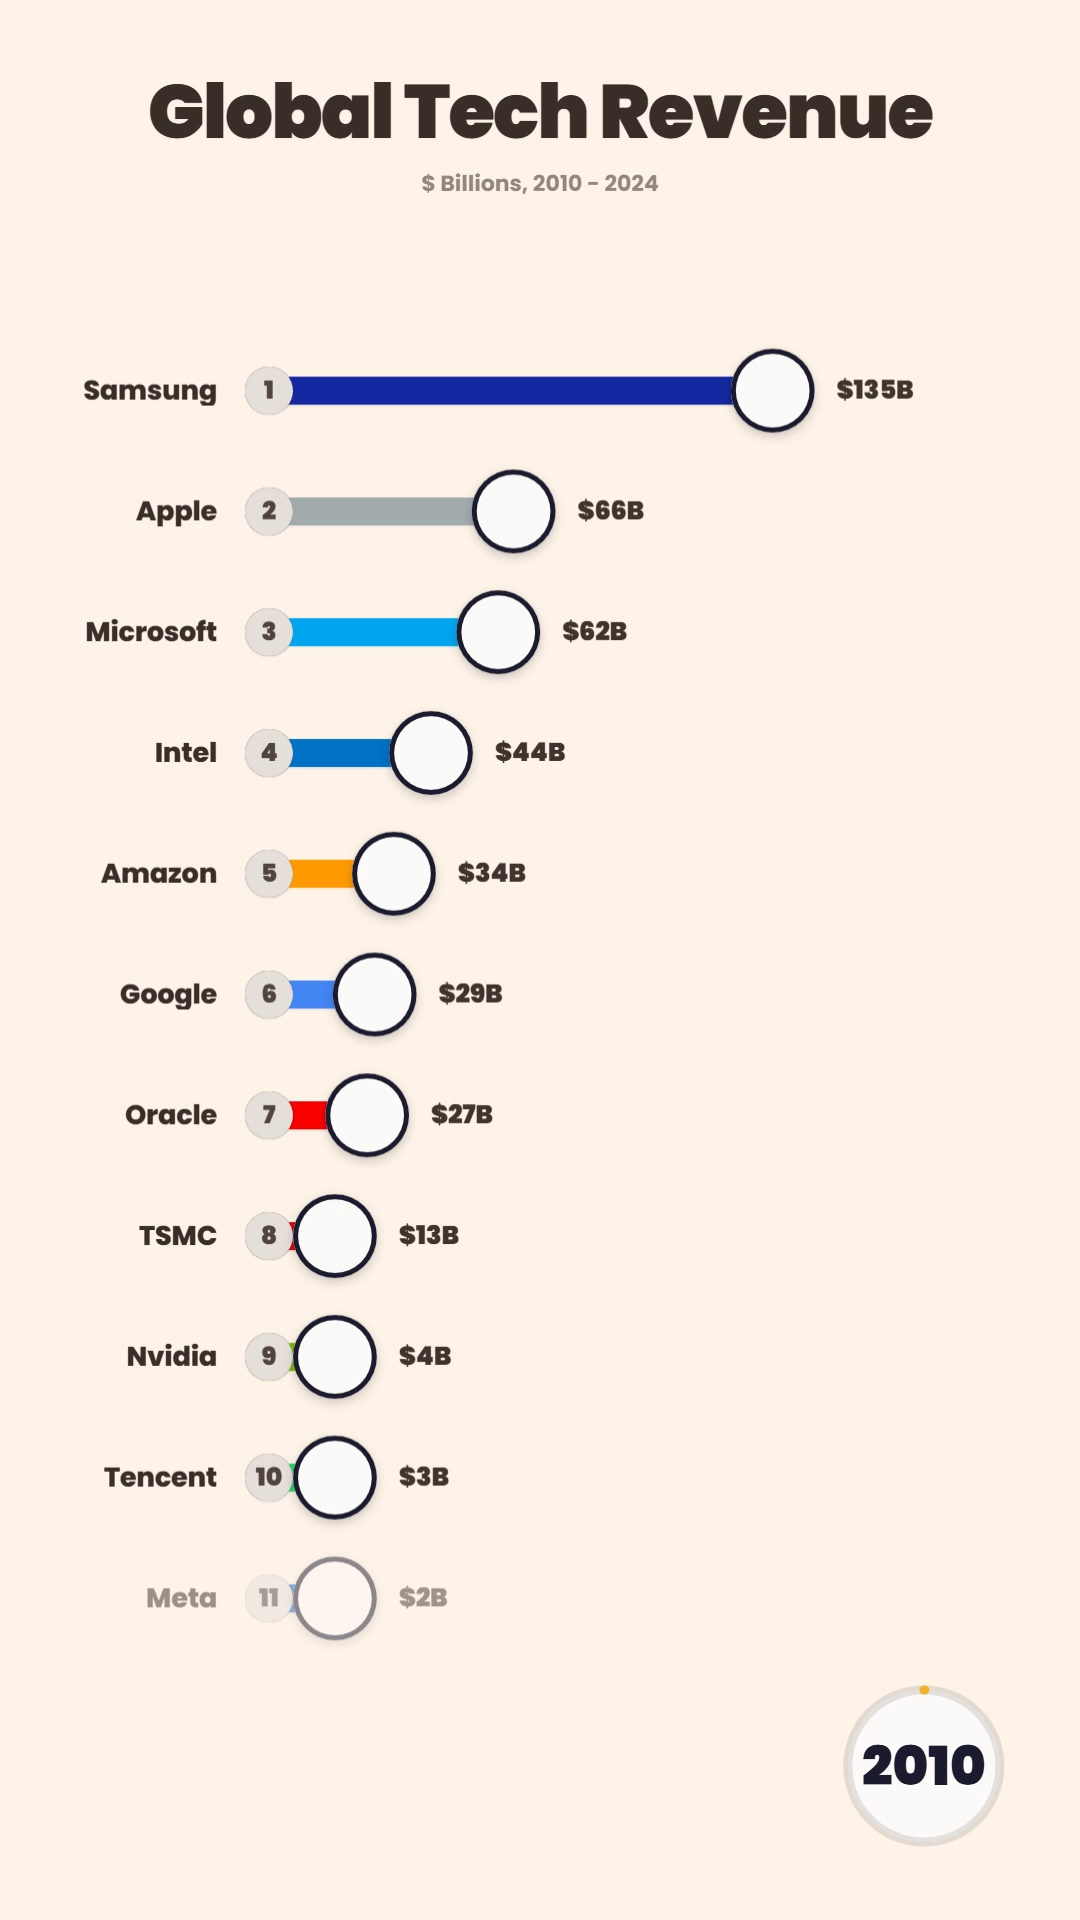
Turn numbers into a story.
Charts, comparisons, and key points — animated to guide attention.
Animated charts
Bar charts, bar chart races, and trends that animate to make the movement in your data clear.
Comparisons
Side-by-side comparisons that build step by step instead of overwhelming the viewer at once.
Lists and key points
Reveal points in sequence with callouts so each takeaway gets its moment.
Visual hierarchy
Coordinated timing and emphasis guide attention to the number that matters most.
Explainer pacing
Pair visuals with captions and narration timing so a complex idea is easy to follow.
A fast first draft
Start from a template or prompt, drop in your numbers, and refine the result.
How it works
From raw numbers to a clear data video in three steps.
- 1
Add your data
Start from a chart template or prompt and enter your numbers and labels.
- 2
Animate the story
Set the order, pacing, and emphasis so the trend or comparison reads clearly.
- 3
Export to share
Export for a presentation, a post, or an explainer in the format you need.
Best for — and not for
Framebit is built for clear, animated data and explainer video. Highly specialized scientific visualization or advanced 3D may still require dedicated tools.
Questions
What data videos can I make?
Animated charts, bar chart races, comparisons, ranked lists, and explainer segments. Coordinate motion and timing so trends and key points are easy to follow, then export for a post, a deck, or a video.
Can I animate my own numbers?
Yes. Start from a chart template or the bar chart race tool, enter your data and labels, and the animation follows your values. Adjust the pacing and emphasis to tell the story you want.
Can I combine charts with narration or captions?
Yes. Pair animated visuals with captions and timing so a complex point stays clear, and keep everything editable in one project until you export.
Make your next data video in Framebit.
Start with AI, a template, or your own footage, then make every part of the result your own.